Hot-plate temperature experiments
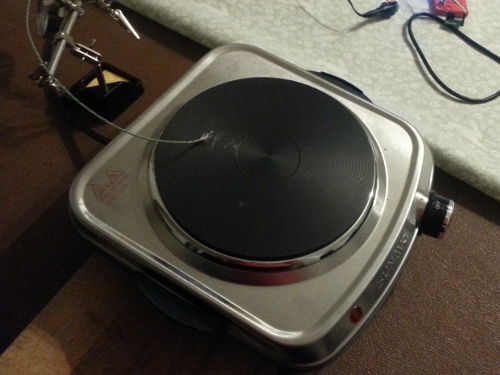
07 November 2020Back in the summer I bought a Sunav
CB-H21 which is a cheap-ish cast iron topped 1500-watt portable electric hob I found on Amazon, which I got for the purpose of hot-plate reflowing some PCBs.
My ultimate goal is to have a fully automated system and one part of doing this is knowing how the hot-plate performs.
This article is a collection of results I got together over the course of the last few months.
Initial experimentation
The first set of experimentation were done back in July and after much thought I decided to present here what I wrote about them at the time. These experiments were done manually using a stop-watch and writing down the figures on paper, which is why the data has a rather low sampling rate, but it nevertheless did give at least an approximate idea of how the hot-plate reacts. Originally I thought about using a purely time-based system but one thing that was clear from these experiments is that temperature feedback would be required for good results.Pre-heat ramp up
For the first experiments I was interested in how quickly the hotplate heats up from a cold start. For these initial measurements I used an infra-red thermometer to measure the temperature of the stainless steel plate on top of the hotplate every ten seconds, and the results are plotted in the graph below. The ideal line is derived from the thermal profile within the data-sheet for the solder paste, and the other four data serious correspond to four experimental runs.
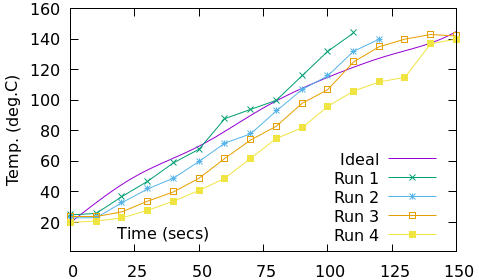
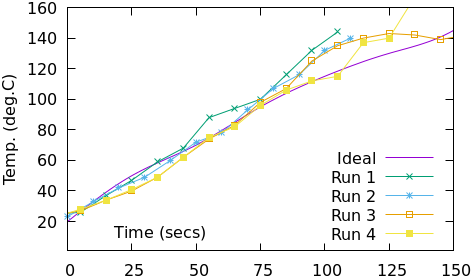
What I noticed is that there was quite a lot of variance in the time between switching the hotplate on and any significant rise in temperature, but once it got going the rate of temperature increase was noticeably consistent. To illustrate this in the graph below the experimental runs have been given different time offsets so that the point each series reaches 100°C is the same.
I was rather lucky in that the gradient of the experimental data series closely matched that of the ideal, and it was clear that the best thing to do was to keep the hotplate switched on until it had reached around 100°C rather than trying use a fixed time.
Soak time
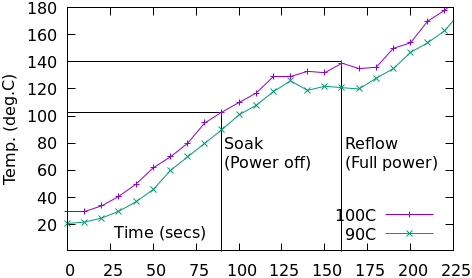
For the soak stage I did considered undervolting the hotplate, but soon saw practical problems in doing so. 1,500 watts was too much power for a dimmer switch and variable transformers are not a cheap, so I was expecting I might need some sort of duty cycle of perhaps 50-60%. However before that I decied to see what happeend with the temperature when the hotplate was turned off. In the first I switched off the hotplate for 70 seconds once it had reached 100°C and noted that it levelled off at 130°C. For the second I reduced the switch-off temperature to 90°C and in this case it levelled off at 120°C. The data-sheet gives 110-139°C as the soak temperature so the latter was what I aimed for.
Reflow stage
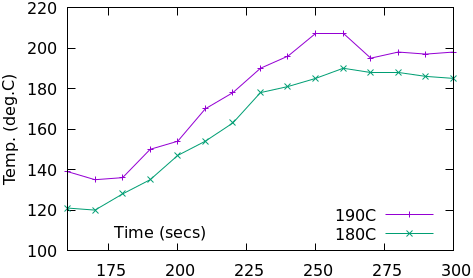
As with initial start-up there was also some lag between the hotplate being turned back on at the end of the soak and further increase in temperature. The reflow stage follows much the same idea as the soak stage — switch off the hotplate once the temperature is significantly above the 140°C solder melting point, but also low enough that the temperature does not hugely overshoot the recommended peak temperature of 160-180°C. The graphs below show the reflow stage of the experimental runs, where the final switch-off temperature was 190°C and 180°C respectively; these were higher than I intended but otherwise saw the level-off trend I was expecting.
Thermocouple readings
Later on I developed circuitry that used thermocouples to measure temperature and as a result was able to obtain temperature reading in a more automated way. Although the general trend was the same as the manual experiments using the infra-red thermometer the numbers found by experimentation are a little different. As a starting point based on some quick tests I settled on the procedure summarised in the table below, which consists of having heater power on until a certain temperature is reached and then having the heater off for a timed period.
| Stage | Criteria |
| Preheat | Power on until 115°C |
| Soak | Power off for 60 seconds |
| Ramp-up | Power on until 155°C |
| Cool-down | Power off |
Bare hot-plate
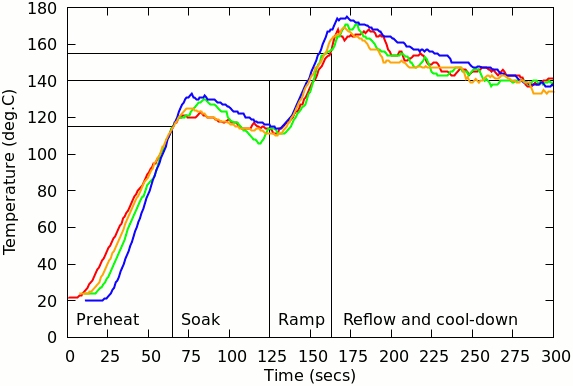
The time-series for four experimental runs using the above criteria are shown in the graph below, with have been shifted so that the point in time that 115°C is reached is the same. I suspect the variance in the power-off stages is due to sensitivity of the exact point on the hot-plate that the thermocouple is touching and this is particularly problematic for the soak stage where the range of values is close to both ends of the specified temperature requirements. The reflow peak is rather skewed towards the start but without active cooling there is not that can be done about the slow cool-down.
Steel spreading plate
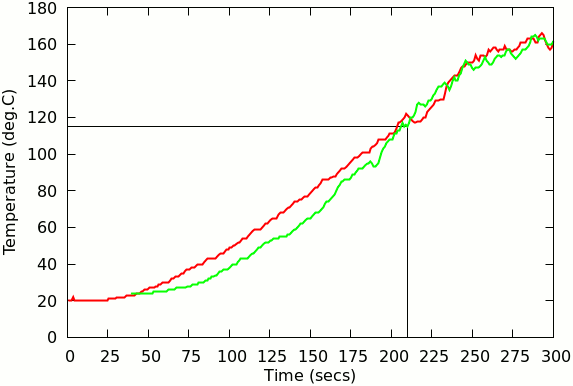
I repeated the experiments but with a steel plate in place that is intended to spread the heat out, although this comes at the expense of much greater lag due to heat capacity. As shown below for two plates of different sizes — one of 10x10cm and the other 20x20cm — temperate continues to rise for around another 50°C after heating power is switched off, so the plateau for intended for the soak is completely absent. My assumption is that the thermal mass of steel is simply too high and that a less dense material should be used instead, although it it useful knowing that the size of the plate did not significantly affect the levelling-off part of the temperature profile.
Aluminium spreading plate
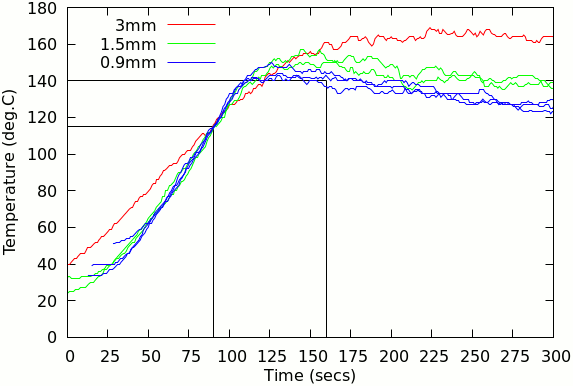
After finding the thermal density of steel far too high I ordered in some aluminium plates, and selected four different thicknesses order to see how this affects the temperature profile, of which the results are shown below. Lines of the same colour are experimental runs with the same plate. With the massive overshoot with the 3mm plate I did not even bother testing the 2mm plate. Although the 0.9mm plate was closest to the target I preferred the way the 1.5mm plate levelled-off that bit more slowly rather than starting a decline within the minute.
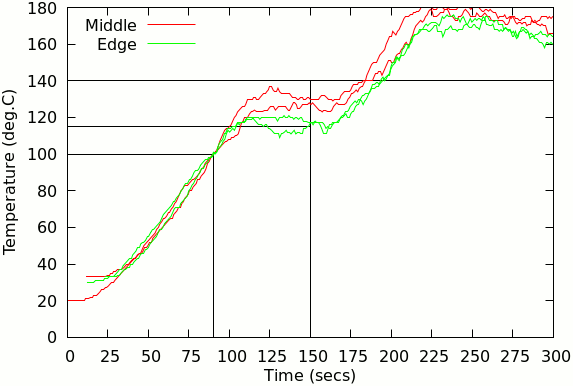
I felt that the optimal thickness would be 1.2mm so I ordered in a slightly larger 15x15cm plate of this thickness. In repeat experiments using this new plate the soak trigger temperature was reduced to 100°C and the results are shown below. There was a slight difference depending on whether the thermocouple was place right in the centre or towards the edge of the aluminium plate but the centre gave a near-enough perfect profile that I was going to get with such a setup.
I also did a test reflow although the lack of a stencil meant I almost certainly used too much solder paste, which in turn was some old stock that had been stored at a lot higher temperature than it should have been, so this was probably a poor test for cross-checking purposes. It did not help that the test component was a low-impedence inductor that gave a false-positive for checking bridges with a multi-meter.
Automated control
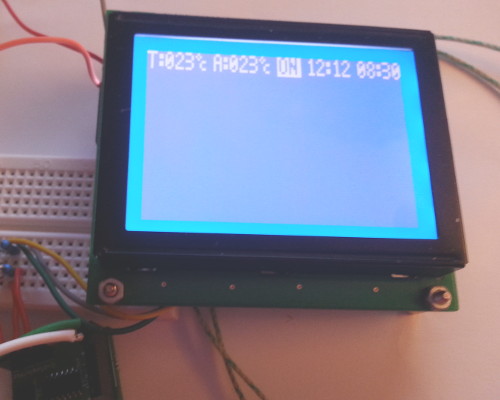
Although it is only at the prototype stage as there is much I still need to figure out, in the process of doing these experiments I did manage to automate part of the process. Using the ARM-based LCD dot-matrix display as a base, temperature sensing and the soak-time countdown is handled is firmware, but turning the hot-plate itself on and off is still done manually based on what the display indicates. I have built some AC power switching circuits but so far they are not rated for the current draw expected of a power requirement in the kilo-watt region. At the moment I am unsure whether it will be enough to just opt for a simple on-off relay, or whether to use a Triac-based solution that also allows a measure of adjustment to supplied electrical power.
Future plans
At some point in the future I might look at duty-cycling but so far relying largely on physics rather than closed-loop control seems to obtain the results I desire. The profiles here are for MG Chemicals4902P-25G solder paste although in the past I have used other pastes that have different profiles, so at some point I will need to do further experiments to tune the apparatus for these other brands.
Chip Quik have bought out TS391LT which is a new formula which supposedly does not require refrigeration so at some point I will give that one a try.