Taxes don't follow spending
20 June 2013One of the problems I constantly see over arguments over the deficit is that numbers are always quoted with respect to Gross Domestic Product, which as a measure I am increasingly distrustful of. The underlying problem is that tax revenue has a link to GDP, whereas government expenses are mostly divorced from it. Fortunately I was able to obtain figures that are quoted in absolute terms, and this helps illustrate the problems of different trends.
The dataset I used is the World Bank's figures for the UK, and the three parameters are GC.REV.XGRT.CN (Revenue excluding grants), GC.XOPN.TOTL.CN (Expenses), and NY.GDP.MKTP.CN (Gross Domestic Produce). All three of these are quoted in 2011 pound sterling, and the dataset goes back to 1995, although it is not clear whether the year quoted is the start or the end of a given financial year. In any case I think the most useful graph is one showing costs & expenses in absolute terms:
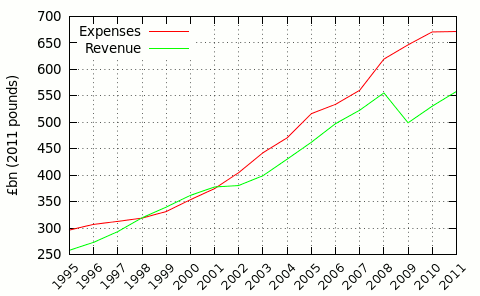
Of note is that between 1998-2001, 2003-2007, and again in 2009-2010, the gradients are approximately the same. The problem is the two time periods 2001-2003 and 2008-2009. Basically revenue took a knock, but spending continued on the same trend, which built in a structural deficit. At this point is is instructive to add in GDP, as it shows why this is a bad idea:
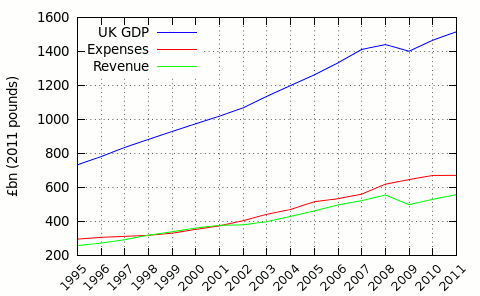
It is pretty clear that revenue (mainly taxes) tracks GDP, and the 2007-2009 credit crunch where the economy shrank, had a clear knock-on effect. Problem is that even though a pre-crunch trend in GDP has more or less returned, the gap remains. The latter is what puts a hole in the return-to-growth arguments peddled by deficit deniers: a return to growth is not enough. They pretty much operate on the principle that something magic will happen in the indeterminate future, which although not impossible, is definitely not something to assume when making planning decisions. Sooner or later the deficit has to disappear, which nicely brings us onto the usual rendition of income and revenue in terms of GDP:
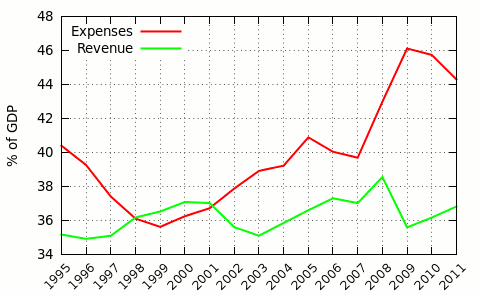
Not entirely sure what happened in 2001-2003, but it coincided both with the aftermath of the dot-com crash, which was also a time when interest rates went through the floor. Since GDP went up during this time, I can only conclude that money within the economy shifted into areas that attracted a lower rate of taxation. I'm not sure if this was intentional tax efficiency or just a coincidence in changes in the economy, (probably both), but as a proportion of GDP revenue has hardly ever left the 35-37% region. Given that since 2005 many business taxes have sky-rocketed, for instance business rates and employer NICs went up 80%, there is clearly a reaction against tax take getting much higher. That means that spending has to match revenue, rather than the usual socialist delusion that revenue can match spending.